

Hey Everyone!
I was inspired to do this project by Josh Madakor. He is an excellent resource for all things Cybersecurity. The link to the tutorial can be found here.
For this project, Azure was used.
The project consisted of creating a virtual machine, allowing all traffic to the firewall for that virtual machine, creating a log analytics workspace, connecting the workspace to the virtual machine, disabling the firewall on the virtual machine, using a Powershell script to gather data from attackers and finally creating a map in Sentinel that showed the attacks that occurred from the Netherlands and Luxembourg.
A brief overview of the steps taken can be seen below:
Create Azure Subscription
Create Virtual Machine
Allow all traffic into Firewall: This is done during the "Create a VM" step where a Network Security Group is created. Create an inbound rule which will allow all traffic to flow into the VM's network. For destination port ranges and source ranges, input a wildcard (*) to allow for all. Place the priority as 100.
Create Log Analytics Workspace
Enable gathering VM logs in Microsoft Defender for Cloud
Connect Log Analytics to VM
Setup Azure Sentinel
Log into VM with Remote Desktop
Observe Event Viewer Logs in VM
Turn off the Windows Firewall on VM
Download PowerShell Script: https://github.com/joshmadakor1/Sentinel-Lab/blob/main/Custom_Security_Log_Exporter.ps1
Get Geolocation.io API Key: This involves getting the key for your own IP address
Run Script To get Geo Data from attackers: Insert your unique API key into the script
Create a custom log in Log Analytics Workspace to bring in our custom log: To do this, navigate to tables, and select new custom log as MMA based.
Create custom fields/extract fields from raw custom log data
Testing Extracts
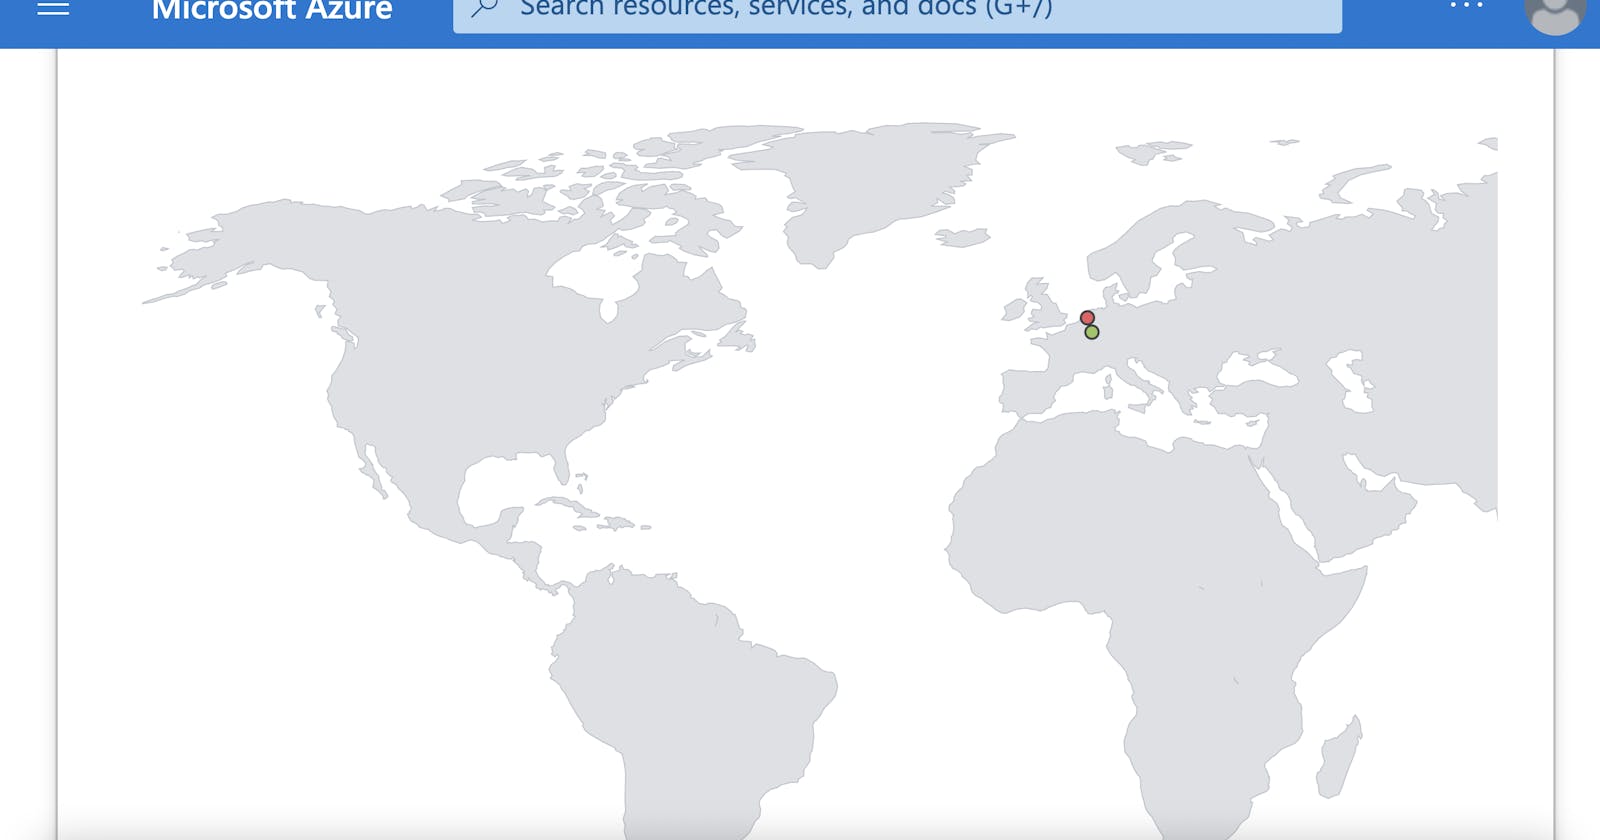
Setup map in sentinel with Latitude and Longitude (or country)
For data extraction to create the map in sentinel, the following script was used in the workbook:
FAILED_RDP_WITH_GEO_CL | extend username = extract(@"username:([^,]+)", 1, RawData), timestamp = extract(@"timestamp:([^,]+)", 1, RawData), latitude = extract(@"latitude:([^,]+)", 1, RawData), longitude = extract(@"longitude:([^,]+)", 1, RawData), sourcehost = extract(@"sourcehost:([^,]+)", 1, RawData), state = extract(@"state:([^,]+)", 1, RawData), label = extract(@"label:([^,]+)", 1, RawData), destination = extract(@"destinationhost:([^,]+)", 1, RawData), country = extract(@"country:([^,]+)", 1, RawData) | where destination != "samplehost" | where sourcehost != "" | summarize event_count=count() by latitude, longitude, sourcehost, label, destination, country
My live attack data consisted of attacks from only two locations.
Attached is a link to the logs gathered showing attacks and security events: https://drive.google.com/file/d/1mkOudZIW0l37CZTgoL7r5qcNsuxsQHJe/view?usp=sharing
Quick tip, the free API key can only handle so many requests. I left the VM as it was overnight and received an email saying my daily request limit was reached :D.
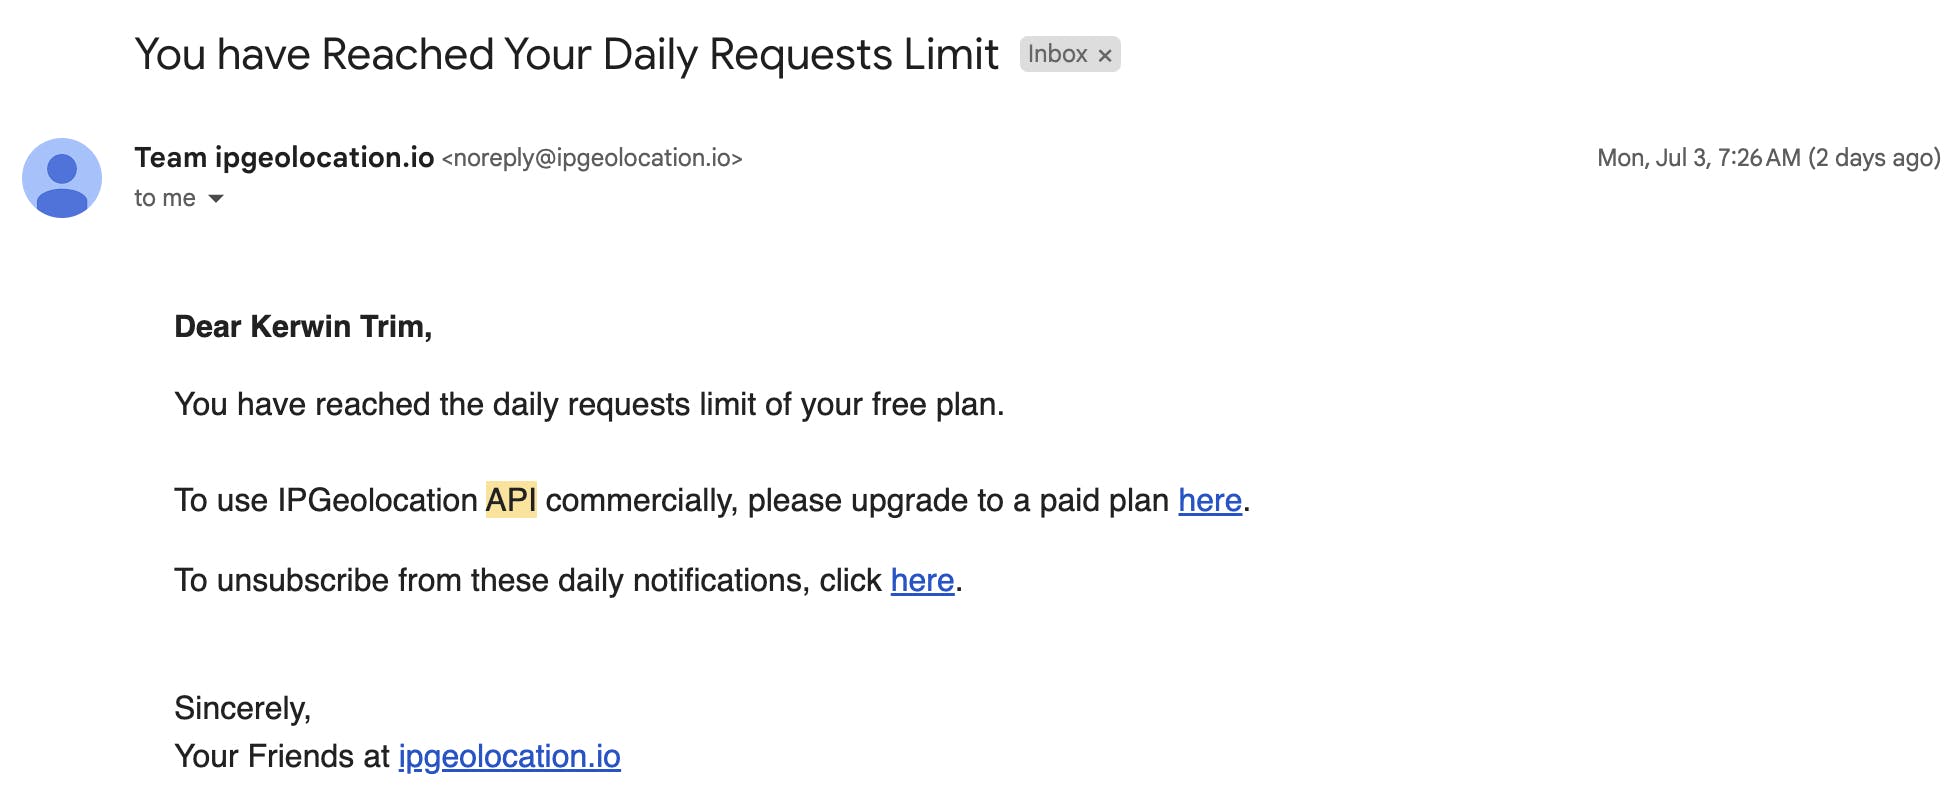
Safe to say with the amount of security events that I received, the request limit was bound to be reached in a short period. You can see the amount of activity that was generated in the screenshot below.
Screenshot showing the number of security events that occurred:

Below are additional screenshots showing some of steps done.
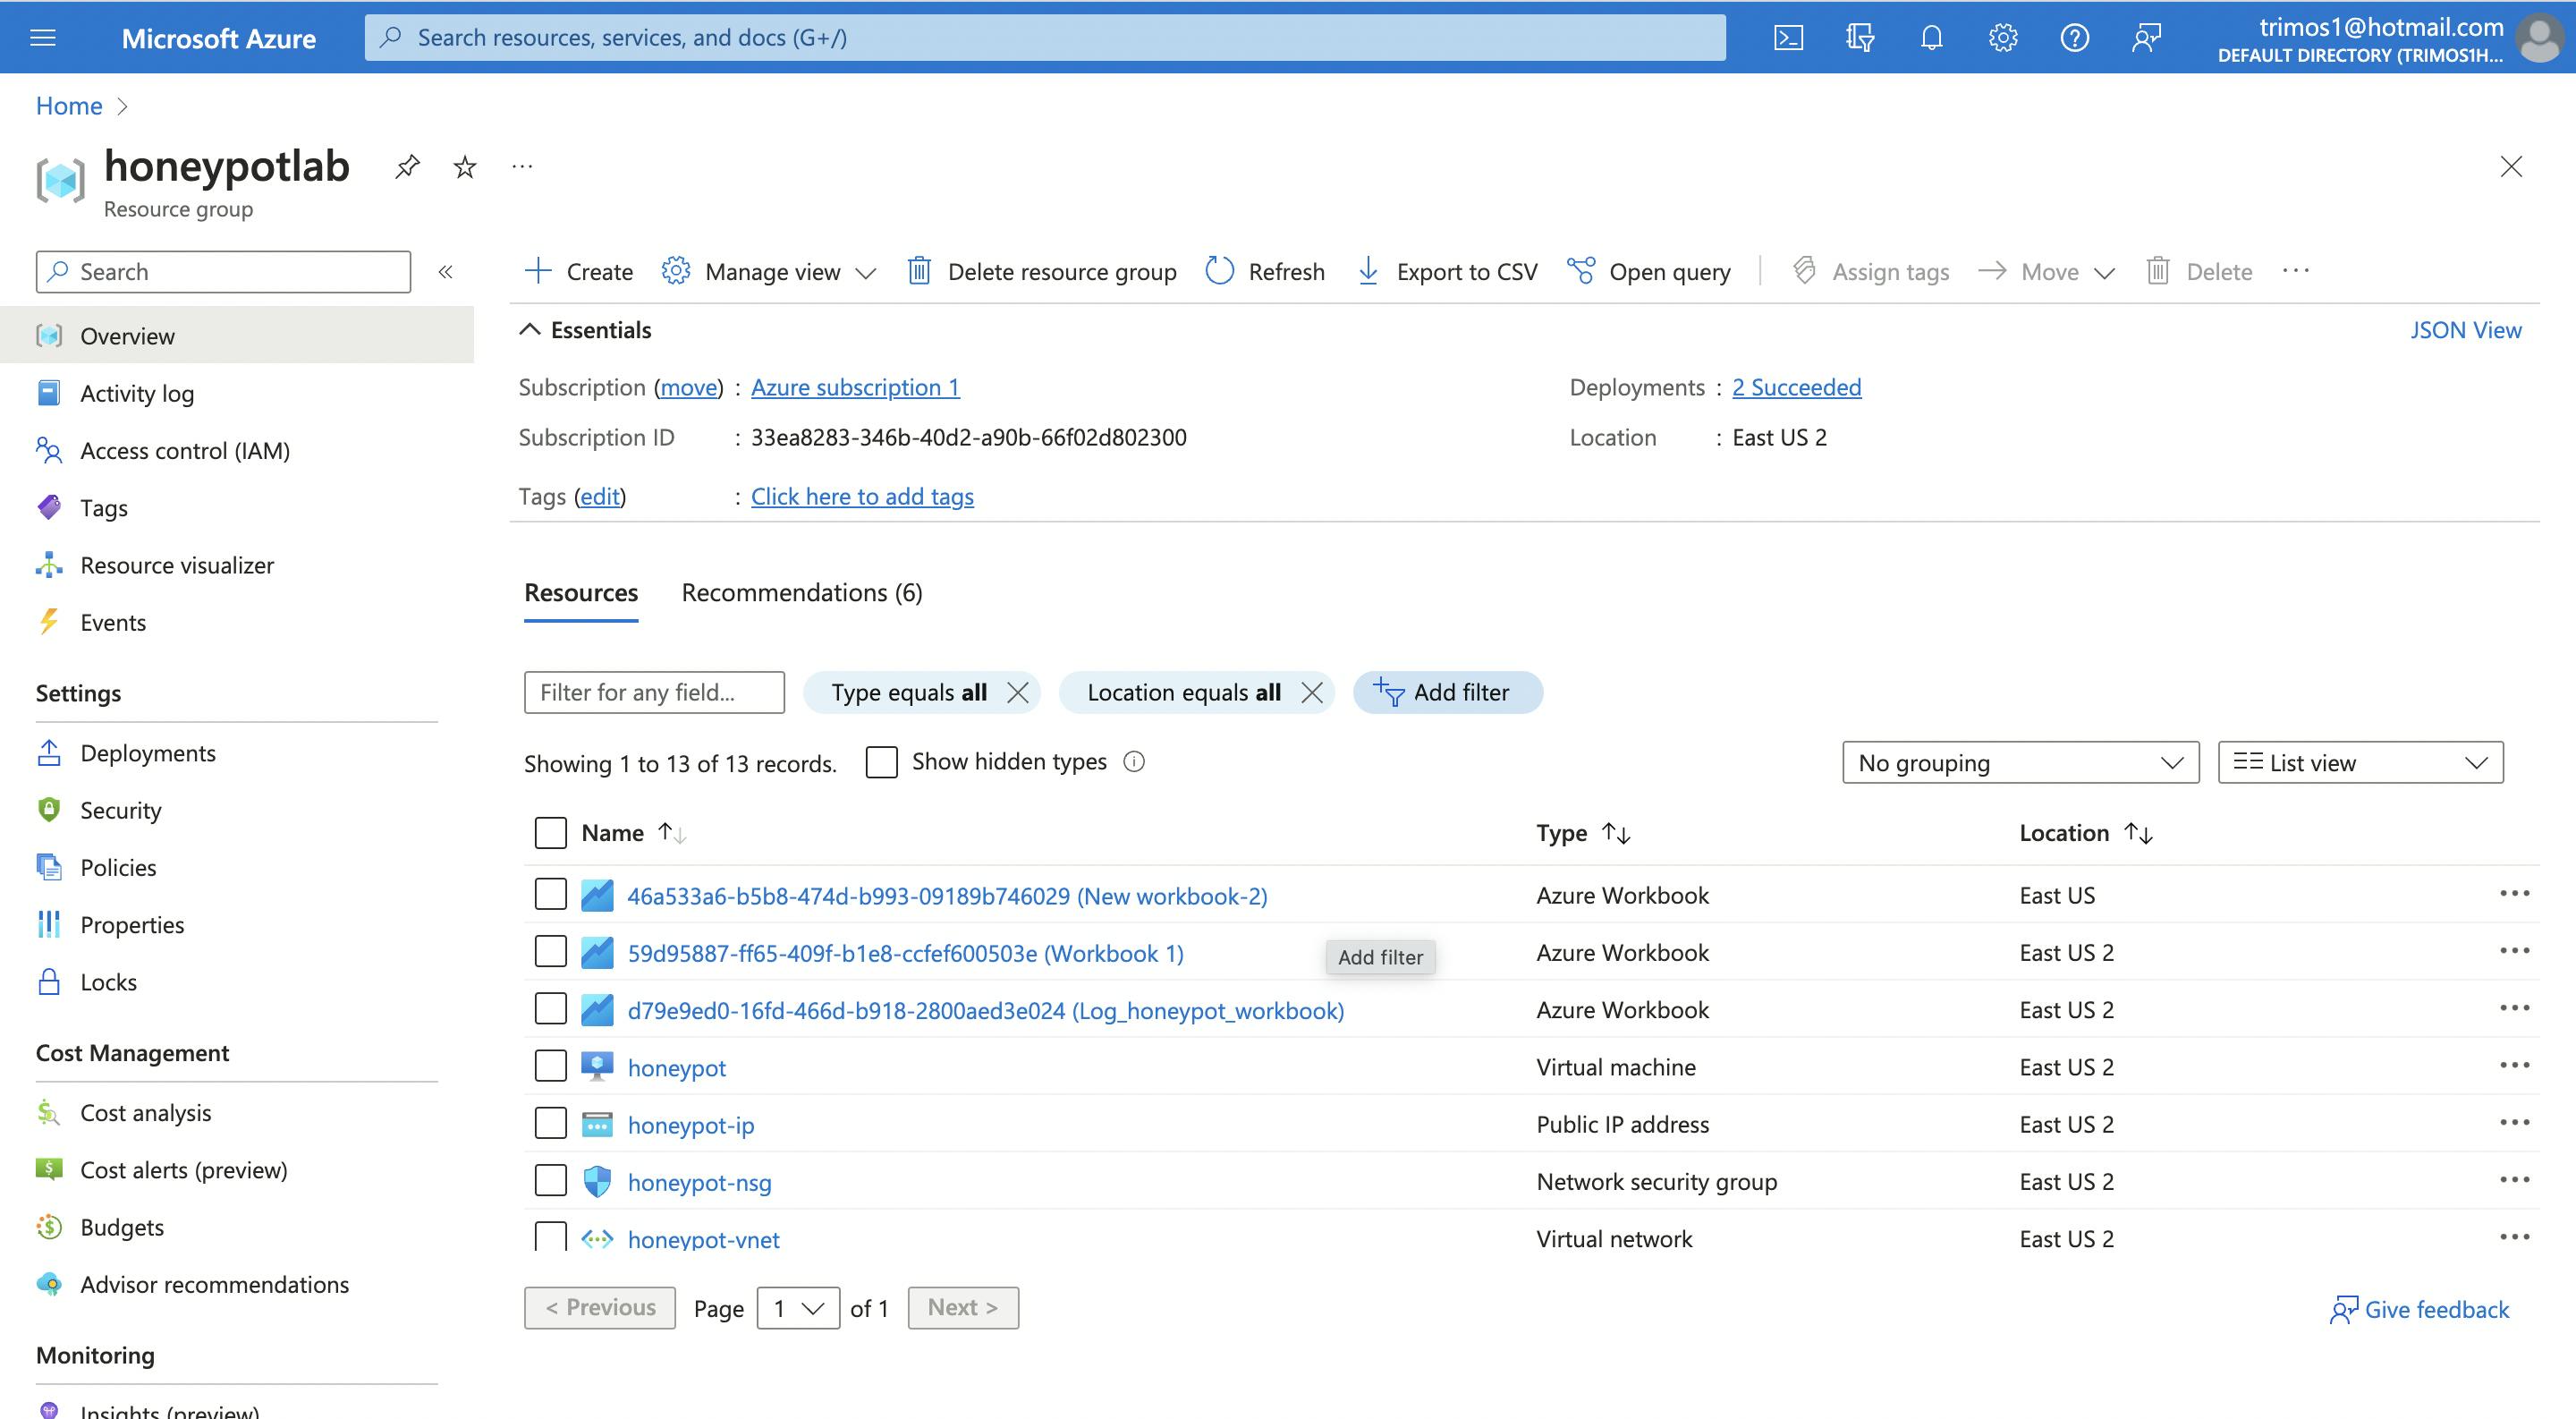
Screenshot showing the Virtual Machine created as "honeypot"

The screenshot shows the resource group that was created
Screenshot showing that traffic was successfully able to enter the firewall:
